Intermediate · Leadership · DOC-RES-08

Resource Ledger

Data Center Energy, Water, Efficiency (PUE/WUE) & Capacity Ledger

Measure, audit, and explain energy (PUE), water (WUE), carbon boundaries, and stranded rack capacity without letting headline ratios hide weather or reliability risk.

Start Lesson 1 (~15 min open)
Open sample & effort
All 5 browser lessons & capstone open free (~75 min reading; no login).
Prerequisites
Thermal Reality or Utility to Rack, or basic familiarity with kilowatt-hours (kWh), liters/gallons, and cooling loops. Designed for: Capacity planners, sustainability & resource analysts, mechanical/electrical engineers, and facility managers.
Tuition & cohort enquiry ($399 · $1,600 list)

Course outline · 5 open browser lessons (~75 min reading)

  1. 01Metering boundaries and data integrity~15 min read
  2. 02Energy performance, losses, and PUE math~15 min read
  3. 03Water performance, blowdown, and WUE tradeoffs~15 min read
  4. 04Stranded capacity and thermal reserve margins~15 min read
  5. 05Executive reporting without greenwashing~15 min read

Plus 1 unmeasured end-of-course capstone check and self-paced DOC-RES-08 deliverable rubric in the open studio below.

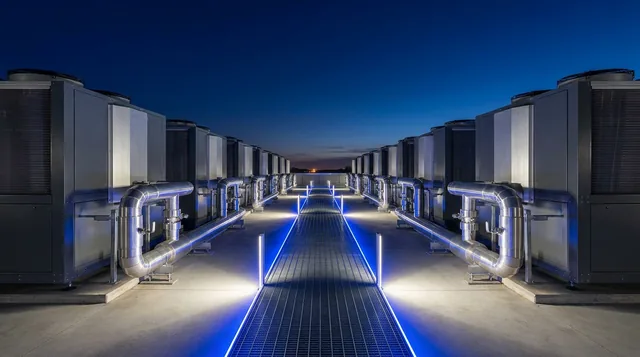
Adiabatic free-cooling chillers and primary chilled-water headers at dusk
FIG. 01 · DOC-RES-08Data Center Energy, Water, Efficiency (PUE/WUE) & Capacity Ledger
Prerequisites
Thermal Reality or Utility to Rack, or basic familiarity with kilowatt-hours (kWh), liters/gallons, and cooling loops. Designed for: Capacity planners, sustainability & resource analysts, mechanical/electrical engineers, and facility managers.
Study scope
Open now: ~75 min approximate reading across 5 interactive browser lessons (~15 min each). Self-paced & unmeasured: end-of-course capstone check, paired Campus Shift exercise, and drafting your DOC-RES-08 deliverable. Extended cohort scope: 5 hours extended syllabus & project scope.
Deliverable
Portfolio deliverable: A resource-performance ledger brief with metering boundaries, calculations, and reliability guardrails. (DOC-RES-08)
Tuition & enquiry
$399 self-paced tuition ($1,600 list). All 5 lessons below are already open free; submitting the enquiry form records your email for manual follow-up with no online card checkout or gated account login.
Progress & terms
6/6 lesson and capstone checks save in this browser (localStorage with session fallback). Independent professional-development training, not an accredited certificate/degree, trade license, vendor credential, or live-site switching authorization.
Paired Campus Shift mission
36°C Heatwave Economizer, PUE & Water Balance (free interactive Campus Shift in browser)
Recommended next course
AI Density Lab: Apply power, water, and capacity accounting to 80 to 130 kW per rack AI GPU halls where thermal margins shrink.
Scope note & primary engineering references (3 cited)

Open browser lessons total ~75 min approximate reading across 5 modules; the end-of-course capstone check, paired Campus Shift exercise, and self-paced DOC-RES-08 deliverable draft are separate unmeasured practice outside the extended cohort scope (5 hours extended syllabus & project scope).

  • ISO/IEC 30134-2 (Power Usage Effectiveness: PUE Categories 1, 2, and 3 measurement boundaries and annualized reporting)
  • ISO/IEC 30134-9 (Water Usage Effectiveness: WUE Categories 1, 2, and 3 site water vs reuse and regional stress context)
  • ASHRAE TC 9.9 & Green Grid Guidance (wet-bulb economizer curves, part-load efficiency, and power-vs-water operational tradeoffs)

Interactive self-paced studio

Study Resource Ledger right now, at your own pace.

Self-paced progress · 0/6 checkpoints verified
Lesson 1 of 5 · ~15 min studio (60 min syllabus scope)

Metering boundaries and data integrity

Key terms defined in plain language first
PUE Formula & ISO Categories (PUE₁, PUE₂, PUE₃)

PUE = Total Data Center Energy ÷ IT Equipment Energy (always ≥ 1.0). ISO/IEC 30134-2 defines Category 1 (PUE₁) metered at UPS output, Category 2 (PUE₂) at PDU output, and Category 3 (PUE₃) right at IT server input.

Measuring IT energy upstream at UPS output (PUE₁) counts PDU/transformer heat as 'useful IT work', making PUE look artificially lower than PUE₃.
Numerator Boundary Completeness

Total Data Center Energy must include ALL energy crossing the utility boundary to run the facility: IT load + UPS/transformer losses + chillers/pumps/CRAHs + lighting + generator block heaters/fuel.

Omitting a central chilled-water plant fed from a shared campus loop without thermal-energy allocation invalidates the ratio.
Instantaneous kW Ratio vs Annualized kWh PUE

A 03:00 AM winter kW snapshot ('instantaneous power ratio') is NOT official ISO PUE, which integrates cumulative energy (kWh) over a full 12-month weather cycle.

Quoting a cool-January snapshot as 'our facility PUE' misleads capacity and sustainability teams when July arrives.
Field engineering briefing

Two facilities can run identical chillers and UPS lineups, yet report 'PUE 1.12' and 'PUE 1.24' purely because they placed their energy meters at different points on the one-line diagram! Before interpreting any efficiency trend, audit what is inside the numerator, where the denominator is metered (ISO/IEC 30134-2 Category 1, 2, or 3), and whether ancillary loads were left out.

Where total facility energy, IT load (UPS vs PDU vs rack), and makeup water are metered under ISO standards.

Why ISO Category 1, 2, and 3 change both numerator impact and denominator

None of ISO Category 1, 2, or 3 is 'dishonest' when explicitly labeled (PUE₁, PUE₂, PUE₃), because older halls may lack smart metered rack PDUs needed for PUE₃. What distorts decisions is comparing an unlabeled PUE₁ (where ~3% to 5% downstream transformer and busway heat sits inside the denominator) against another site's strict PUE₃, or dropping generator diesel test kWh and block-heater loads out of the numerator.

Checking missing sub-meters and CT multiplier bugs

Energy ledgers break quietly when a newly commissioned Chiller 4 feeder is omitted from the EPMS summation tag or a Current Transformer (CT) ratio is typed as 800:5 instead of 1,600:5. Always cross-check the sum of internal sub-meters against the revenue utility billing meter every month!

System state-change diagram

ISO/IEC 30134-2 Boundary Check: Same Physical Plant under PUE₁ vs PUE₃

Viewing: 2. Trigger: Downstream PDU/Cable Loss: 400 MWh
Swipe sideways on narrow screens · Node values below
Total Facility Energy(E_DC)Includes IT + Cooling+ LossesCategory 1 (UPSOutput)Counts 400 MWh PDUheat as IT!Category 3 (ServerInput)400 MWh stays inoverheadUnmetered ChillerTrapFake E_DC = 11,200 MWh
  1. 1. Total Facility Energy (E_DC)Includes IT + Cooling + Losses
  2. 2. Category 1 (UPS Output)Counts 400 MWh PDU heat as IT!
  3. 3. Category 3 (Server Input)400 MWh stays in overhead
  4. 4. Unmetered Chiller TrapFake E_DC = 11,200 MWh

See how moving the IT meter point from UPS Output (Category 1) to Rack Input (Category 3) changes reported PUE on the exact same building.

Accessible text walkthrough & 3-state comparison table

On a building consuming 12,000 MWh total with 9,600 MWh reaching server inputs and 400 MWh lost in PDUs/cables, Category 1 (UPS output = 10,000 MWh) reports PUE₁ = 1.20 while Category 3 (server input = 9,600 MWh) reports PUE₃ = 1.25 for the exact same physics.

System node1. Utility Revenue Meter: 12,000 MWh2. Downstream PDU/Cable Loss: 400 MWh3. Label Category Explicitly!
Total Facility Energy (E_DC)12,000 MWh at utility fenceIncludes IT + Cooling + LossesMatches utility bill 100%
Category 1 (UPS Output)Reads 10,000 MWhCounts 400 MWh PDU heat as IT!PUE₁ = 12,000 / 10,000 = 1.20
Category 3 (Server Input)Reads 9,600 MWh true IT400 MWh stays in overheadPUE₃ = 12,000 / 9,600 = 1.25!
Unmetered Chiller TrapIf 800 MWh chiller omittedFake E_DC = 11,200 MWhInvalid 1.12 ratio · Fix sum!

On a building consuming 12,000 MWh total with 9,600 MWh reaching server inputs and 400 MWh lost in PDUs/cables, Category 1 (UPS output = 10,000 MWh) reports PUE₁ = 1.20 while Category 3 (server input = 9,600 MWh) reports PUE₃ = 1.25 for the exact same physics.

  • Total Facility Energy (E_DC): Utility Revenue Meter: 12,000 MWh = 12,000 MWh at utility fence; Downstream PDU/Cable Loss: 400 MWh = Includes IT + Cooling + Losses; Label Category Explicitly! = Matches utility bill 100%.
  • Category 1 (UPS Output): Utility Revenue Meter: 12,000 MWh = Reads 10,000 MWh; Downstream PDU/Cable Loss: 400 MWh = Counts 400 MWh PDU heat as IT!; Label Category Explicitly! = PUE₁ = 12,000 / 10,000 = 1.20.
  • Category 3 (Server Input): Utility Revenue Meter: 12,000 MWh = Reads 9,600 MWh true IT; Downstream PDU/Cable Loss: 400 MWh = 400 MWh stays in overhead; Label Category Explicitly! = PUE₃ = 12,000 / 9,600 = 1.25!.
  • Unmetered Chiller Trap: Utility Revenue Meter: 12,000 MWh = If 800 MWh chiller omitted; Downstream PDU/Cable Loss: 400 MWh = Fake E_DC = 11,200 MWh; Label Category Explicitly! = Invalid 1.12 ratio · Fix sum!.
Worked engineering example

Calculating PUE₁ vs PUE₃ and catching a missing sub-meter via utility reconciliation

Given scenario

Illustrative monthly audit: Utility revenue bills show 8,640,000 kWh (8,640 MWh) delivered to Site B in May (zero solar/generator run). Internal EPMS summary reports: Total Facility Tag = 7,920 MWh, UPS Output = 6,850 MWh, Smart Rack PDU Output (IT Input) = 6,600 MWh.

  1. Step 1

    Reconcile EPMS Total against Utility Revenue Meter with units: Discrepancy = 8,640 MWh − 7,920 MWh = 720 MWh missing (8.3% of building energy). Investigation reveals newly added Chiller Skid CH-4 (averaging ~968 kW × 744 hours ≈ 720 MWh) was never added to the EPMS summation formula.

  2. Step 2

    Compute true corrected Category 1 vs Category 3 ratios: True E_DC = 8,640 MWh. True PUE₁ (UPS output) = 8,640 MWh ÷ 6,850 MWh = 1.261 (~1.26). True PUE₃ (Rack IT input) = 8,640 MWh ÷ 6,600 MWh = 1.309 (~1.31).

  3. Step 3

    Quantify how big the pre-audit error was: Unaudited EPMS tag ÷ UPS output gave 7,920 ÷ 6,850 = 1.156, understating true PUE₃ (1.31) by 0.15 purely from a missing chiller tag and unlabeled category.

Operational takeaway: Always reconcile your EPMS totalizer against the utility revenue invoice first, and always subscript PUE₁, PUE₂, or PUE₃.
Optional depth · Scope boundaries & modeling assumptions

Scope & assumptions: Mixed-use buildings (sharing large office floors) or cogeneration/chilled-water-district campuses follow ISO/IEC 30134-2 thermal/electrical weighting factors.

Optional reference table · DOC-RES-08: Metering Boundary & Revenue Reconciliation Table

Defines exact numerator/denominator boundaries at the top of the DOC-RES-08 performance brief.

FieldIllustrative entryVerification rule
Numerator Boundary (E_DC)Utility MV revenue meters M1+M2 + diesel gen kWh (reconciled within ±0.5% of utility bill).Audit EPMS summation formula after every new chiller, CDU, or hall expansion.
Denominator Boundary (E_IT)ISO Category 3 (PUE₃): summed intelligent Rack PDU receptacle kWh across Halls A through D.Exclude CRAH fans, CDU pumps, and white-space lighting from E_IT.
Reporting WindowRolling 12-month kWh PUE₃ = 1.21 (paired with May monthly ratio = 1.24 for variance tracking).Never present a single cool-night kW ratio as annualized site PUE.
Operator field checklist (check off as you review)
Graded checkpoint · Counts toward 6/6Module 1 of 5 verification

Why is Site Alpha's 1.17 ratio invalid as an apples-to-apples Category 2/3 comparison against Site Beta?

During an internal audit, you compare two sites in the same company: Site Alpha reports 'PUE 1.17' by metering IT energy upstream at the 480 V input to its floor transformers/UPS, while Site Beta reports 'PUE 1.22' by metering IT energy at intelligent rack PDU outlets (PUE₃). Leadership asks why Site Beta is 'wasting more energy.'

Lesson 1 of 5 · Open browser studio

Capabilities

What you will verify on shift.

  • Calculate PUE (ISO/IEC 30134-2) and WUE (ISO/IEC 30134-9) accurately while spotting skewed meter boundaries
  • Quantify how part-load UPS/chiller efficiency curves and outdoor wet-bulb shifts move monthly ratios
  • Diagnose stranded capacity when space, breaker amps, UPS kW, or cooling rejection fall out of balance
  • Communicate resource performance clearly to both shift engineers and sustainability/executive stakeholders

Portfolio Deliverable · DOC-RES-08

What you build and keep.

A resource-performance ledger brief with metering boundaries, calculations, and reliability guardrails.

  • ISO PUE and WUE metering-boundary diagram showing included and excluded sub-loads
  • Weather- and IT-utilization-normalized PUE / WUE variance calculation
  • Capacity & operating-tradeoff memo balancing efficiency targets against thermal ride-through

Recommended Next Course

AI Density Lab

Apply power, water, and capacity accounting to 80 to 130 kW per rack AI GPU halls where thermal margins shrink.

Optional tuition-rate enquiry · Separate from the free open browser studio above (no payment card, checkout, or automated credential on this page)

Tuition & cohort enquiry

Reserve Resource Ledger ($399 tuition).

Reserve the $399 self-paced tuition rate ($1,600 list price). All published interactive studio modules on this page are open in your browser right now; submitting sends your rate inquiry for manual email follow-up with no automated billing or gated account creation here.

Intermediate · ~75 min open lessons · 5 hours extended syllabus & project scope$1,600$399
Resource Ledger: Data Center Energy, Water, Efficiency (PUE/WUE) & Capacity Ledger

Portfolio deliverable: A resource-performance ledger brief with metering boundaries, calculations, and reliability guardrails.

Selected self-paced courseResource Ledger (Intermediate) · $1,600 $399

No card or automated billing here · Sends a $399 rate inquiry ($1,600 list) on submit · Open browser studio above.